In this chapter we cover the following:
Introduction to Project Planning Software
Let’s start with the basic fundamentals of project. Project means not only developing a software job !
Project may be:
- It may be Whether that’s building a new house, developing a new set of purchasing procedures, constructing a bridge, sending a rocket to the space, starting a new movie, implementing a new computer system etc., all these needs the same work (the list is potentially endless) these types of endeavours can benefit from applying basic project management techniques. Indeed, failure to do so often leads to less than satisfactory results, or even dismal failure.
To many people, the mere mention of the term project management makes them cringe. It conjures up visions of performing large amounts of dull, tedious, boring exercises and doing reams of documentation that just doesn’t matter. This attitude isn’t entirely unwarranted, especially for those who have worked in large bureaucratic organizations.
Too often in those environments the work associated with the management of the project becomes the main tasks that get done, while the real work doesn’t always get accomplished. As an example, many project management software applications come complete with tons of functionality, but, they can also be way too complicated and unwieldy for most people. Trying to learn how to use such project management software, then keep the plan accurate and up to date, becomes a frustrating, full time job all in itself.
The result is a strong desire to avoid following those seemingly cumbersome techniques.
“Let’s just get on with the job” – that becomes the all too common approach, and it is a pitfall.
The problem is, just exactly what is “functionality(ie.the job)”?
The reality is you absolutely do need to plan out a project in sufficient enough detail to accomplish the intended goals. The key is to understand just how much detail is necessary to keep everyone on task, and on track, without having the management processes themselves become an unnecessary burden.
All projects, at a minimum, must deal with the following considerations:
- Why are we doing this and what is the overall goal.
- When do we need to be finished.
- What tasks must be done to get there.
- What tasks are not to be done.
- When do the tasks need to be completed and in what order.
- Who is going to actually do the tasks and where.
- What resources and money (budget) is needed.
- What risks are there likely to be along the way.
- How will we keep things on target and monitor progress.
You can’t paint every project with the same brush, but there are some basic practices and tools which should be considered for every project.
1.0 Software project management
1.1 Responsibilities of a software project manager
2.1.1 Job responsibilities of a software project manager skills necessary for software project management
1.2 Software project planning
1.3 The SPMP Document
1.4 Metrics for Project Size Estimation
1.4.1 Lines of code
1.4.2 Function point metric
1.4.3 Project estimation techniques
1.4.4 Empirical estimation techniques
1.4.5 Heuristic techniques
1.4.6 Analytical estimation technique
1.4.7 Expert judgment technique
1.4.8 Delphi cost estimation
1.5 Staffing Level Estimation
1.5.1 Nordens Work
1.5.2 Putnam’s work
1.6 Scheduling
1.6.1 Work break down structure
1.6.2 Activity networks and critical path method
1.6.3 Gantt charts
1.6.4 Pert charts
1.6.5 Project monitoring and control
1.7 Organization and team structures
1.8 Organization Structure
1.9 Team Structure
1.10 Staffing
1.11 Who is a Good software Engineer?
1.12 Risk management
1.13 Risk Identification
1.14 Risk Assessment
1.15 Risk Containment
1.16 Software Configuration Management
1.17 Necessity of Software configuration Managemnt
1.18 Configuration Management Activities
1.19 Source Code control System(SCCS ) & RCS
Cost Estimation
Cost Estimation Models
Software Size Metrics
Empirical Estimation
Heuristic Estimation
Staffing Level Estimation
Effect of Schedule Compression on Cost
COCOMO
(2.1) Introduction to Project Management
A “Project” can be defined as all actions to be realized to fulfill a given need in a given lead-time. Every project has start and end dates, a budget and assigned resources (human or material) to be held.
- Many software projects fail:
- due to faulty project management practices:
- It is important to learn different aspects of software project management.
- Goal of software project management:
- enable a group of engineers to work efficiently towards successful completion of a software project.
A “Project” can be defined as all actions to be realized to fulfill a given need in a given lead-time. Every project has start and end dates, a budget and assigned resources (human or material) to be held.
The project management consists in organizing and in following every action of a project to hold lead-times, costs and the required quality.
The project manager thus guarantees expected results from the project often called "outputs". They can be documents, IT applications, processes…
The Project Management is driven by actors, in phases, by means of tools and specific methods of organization.
Actors of the Project Management
Project Sponsor
It is the customer, the owner of the project. The project sponsor defines the need, the objective and the budget of the project.
The Project Sponsor’s main roles are:
- To supply the functional requirements.
- To make the decisions fundamental to the project
- To represent the users and validate all project’s outputs.
Project Manager
He is going to realize the work and drive the project by respecting lead-times, costs and quality level fixed by the sponsor. While respecting the functional requirements of the sponsor, the project manager is responsible for the technical choices of the project.
Roles are:
- To answer the functional requirements by proposing an adapted technical solution
- To respect lead-times, costs and quality level of the project,
- To organize the project’s day-to-day life.
A project manager’s activities are varied.
can be broadly classified into:
(i) project planning,
(ii)project monitoring and control activities.
(ii)project monitoring and control activities.
2. What are the Phases in Project Management
What are the Phases in Project Management

(2.2) Responsibilities of Project Manager
Responsibility of project managers
Project proposal writing,
Project cost estimation,
Scheduling,
Project staffing,
Project monitoring and control,
Software configuration management,
Risk management,
Managerial report writing and presentations, etc.
(2.3)Project Interfaces
(2.4) Project Planning
Explain about Project Planning ?
Ans:
Once a project is found to be feasible, project managers undertake project planning.
Project Planning Activities:
Estimation:
Effort, cost, resource, and project duration
Project scheduling:
Staff organization:
staffing plans
Risk handling:
identification, analysis, and abatement procedures
Miscellaneous plans:
quality assurance plan, configuration management plan, etc.
Project planning
Requires utmost care and attention --- commitments to unrealistic time and resource estimates result in:
irritating delays.
customer dissatisfaction
adverse affect on team morale
poor quality work project failure.
Sliding Window Planning
Involves project planning over several stages:
protects managers from making big commitments too early.
More information becomes available as project progresses.
Facilitates accurate planning (2.5) The SPMP(Software Project Management Plan) Document
Explain about SPMP Document?
Ans:
After planning is complete:
Document the plans:
in a Software Project Management Plan(SPMP) document.
Organization of SPMP Document
Introduction (Objectives,Major Functions,Performance Issues,Management and Technical Constraints)
Project Estimates (Historical Data,Estimation Techniques,Effort, Cost, and Project Duration Estimates)
Project Resources Plan (People,Hardware and Software,Special Resources)
Schedules (Work Breakdown Structure,Task Network, Gantt Chart Representation,PERT Chart Representation)
Risk Management Plan (Risk Analysis,Risk Identification,Risk Estimation, Abatement Procedures)
Project Tracking and Control Plan
Miscellaneous Plans(Process Tailoring,Quality Assurance)
(2) What is Software Cost Estimation
Ans:
Software Cost Estimation
Ans:
Software Cost Estimation
Determine size of the product.
From the size estimate,
determine the effort needed.
From the effort estimate,
determine project duration, and cost.

Three main approaches to estimation:
Empirical
Heuristic
Analytical
1.4 Metrics for Project Size Estimation
A software metric is a measure of some property of a piece of software or its specifications.
Common software metrics include:
order of growth (See Analysis of algorithms in terms of Asymptotic analysis and Big O notation)
source lines of code
cyclomatic complexity
function points
bugs per line of code
code coverage
number of lines of customer requirements.
number of classes and interfaces
Robert Cecil Martin's software package metrics
Cohesion
Coupling (computer science)
Examples of process metrics affecting software:
Number of times the program failed to rebuild overnight
Number of defects introduced per developer hour
Number of changes to requirements
Hours of programmer time available and spent per week
Number of patch releases required after first product ship
********************************
(2.6) Metrics for Project Size Estimation***
*************************
Metrics are needed to understand the level of process performance, project performance and product performance. They are needed to set goals and measure the trend and rate of improvement. Criteria for effective metrics are:
- Simple.
- Keep them to a minimum.
- Base them on business objectives and the business process - avoid those that cause dysfunctional behavior.
- Keep them practical.
Product Metrics
One accepted method of estimating the size of the product is using the metric KDSI (Kilo or Thousand Delivered Source Instruction) or Kilo Lines of Code (KLOC) - how many thousands of lines of code are required for the project excluding the comments. Based on KDSI, a project can be categorized as small, intermediate, medium, large or very large.
- Small <= 2 KDSI
- Intermediate >2 and <=8 KDSI
- Medium >8 and <=32 KDSI
- Large >32 and <=128 KDSI
- Very large >128 KDSI
Productivity Metrics
Another metric that can be used for measuring the productivity of the programmer is counting the number of lines that can be written by a programmer in one hour i.e. the Delivered Source Instructions (DSI) per hour.
Time required for execution of a project(in hours) = Total KDSI of the project/average KDSI per hour.
1. Software Cost Estimation Techniques
Software Cost Estimation Techniques
Empirical techniques:
an educated guess based on past experience.
Heuristic techniques:
assume that the characteristics to be estimated can be expressed in terms of
some mathematical expression.
some mathematical expression.
Analytical techniques:
derive the required results starting from certain simple assumptions.
***************************
What is Software Size Metrics ?
Ans:
Software Size Metrics
LOC (Lines of Code):
Simplest and most widely used metric.
Comments and blank lines should not be counted.
Disadvantages of Using LOC
Size can vary with coding style.
Focuses on coding activity alone.
Correlates poorly with quality and efficiency of code.
Penalizes higher level programming languages, code reuse, etc.
Measures lexical/textual complexity only.
does not address the issues of structural or logical complexity.
Difficult to estimate LOC from problem description.
So not useful for project planning
**************************************************
Explain about Function Point Metric?
Ans:
Overcomes some of the shortcomings of the LOC metric
Proposed by Albrecht in early 80's:
FP=4 #inputs + 5 #Outputs + 4 #inquiries + 10 #files + 10 #interfaces
Input:
A set of related inputs is counted as one input.
Output:
A set of related outputs is counted as one output.
Inquiries:
Each user query type is counted.
Files:
Files are logically related data and thus can be data structures or physical files.
Interface:
Data transfer to other systems.
Suffers from a major drawback:
the size of a function is considered to be independent of its complexity.
Extend function point metric:
Feature Point metric:
considers an extra parameter:
Algorithm Complexity.
Proponents claim:
FP is language independent.
Size can be easily derived from problem description
Opponents claim:
it is subjective --- Different people can come up with different estimates for the same problem.
---------------------------------------------------------------------------------------------------------------------------
What is Empirical Size Estimation Techniques?
Function point
A function point is a unit of measurement to express the amount of business functionality an information systm provides to a user. The cost (in dollars or hours) of a single unit is calculated from past projcts. Function points are the units of measure used by theIFPUG Functional Size Measurement Method. The IFPUG FSM Method is an ISO recognised S/W metric to size an information systm based on the functionality that is perceived by the user of the information system, independent of the technology used to implement the information system. The IFPUG FSM Method (ISO/IEC 20926 Software Engineering - Function Point Counting Practices Manual) is one of five currently recognised ISO standards for functionally sizing software.
The function user requirements of the software are identified and each one is categorized into one of five types: outputs, inquiries, inputs, internal files, and external interfaces. Once the function is identified and categorised into a type, it is then assessed for complexity and assigned a number of function points. Each of these functional user requirements maps to an end-user business function, such as a data entry for an Input or a user query for an Inquiry. This distinction is important because it tends to make the functions measured in function points map easily into user-oriented requirements, but it also tends to hide internal functions (e.g. algorithms), which also require resources to implement. Over the years there have been different approaches proposed to deal with this perceived weakness, however there is no ISO recognised FSM Method that includes algorithmic complexity in the sizing result. The variations of the Albrecht based IFPUG method designed to make up for this (and other weaknesses) include:
- Early and easy function points. Adjusts for problem and data complexity with two questions that yield a somewhat subjective complexity measurement; simplifies measurement by eliminating the need to count data elements.
- Engineering function points. Elements (variable names) and operators (e.g., arithmetic, equality/inequality, Boolean) are counted. This variation highlights computational function.The intent is similar to that of the operator/operand-based Halstead Complexity Measures.
- Bang Measure also - Defines a function metric based on twelve primitive (simple) counts that affect or show Bang, defined as "the measure of true function to be delivered as perceived by the user." Bang measure may be helpful in evaluating a software unit's value in terms of how much useful function it provides, although there is little evidence in the literature of such application. The use of Bang measure could apply when re-engineering (either complete or piecewise) is being considered, as discussed in Maintenance of Operational Systems—An Overview.
- Feature points. Adds changes to improve applicability to systems with significant internal processing (e.g., operating systems, communications systems). This allows accounting for functions not readily perceivable by the user, but essential for proper operation.
Ans:
Empirical Size Estimation Techniques:
Expert Judgement:
An euphemism for guess made by an expert.
Suffers from individual bias.
overcomes some of the problems of expert judgement
Expert judgement
Experts divide a software product into component units:
e.g. GUI, database module, data communication module, billing module, etc.
Add up the guesses for each of the components.
Team of Experts and a coordinator.
Experts carry out estimation independently:
mention the rationale behind their estimation.
coordinator notes down any extraordinary rationale:
circulates among experts.
Experts re-estimate.
Experts never meet each other
to discuss their viewpoints.
What is Heuristic Estimation Techniques?
Ans:
Heuristic Estimation Techniques
Single Variable Model:
Parameter to be Estimated=C1(Estimated Characteristic)d1
Multivariable Model:
Assumes that the parameter to be estimated depends on more than one characteristic.
Parameter to be Estimated=C1(Estimated Characteristic)d1+ C2(Estimated Characteristic)d2+…
Usually more accurate than single variable models.
What is COCOMO Model
Ans:
COCOMO Model
COCOMO (COnstructive COst MOdel) proposed by Boehm.
Divides software product developments into 3 categories:
Organic
Semidetached
Embedded
COCOMO Product classes
Roughly correspond to:
application, utility and system programs respectively.
Data processing and scientific programs are considered to be application programs.
Compilers, linkers, editors, etc., are utility programs.
Operating systems and real-time system programs, etc. are system programs.
Elaboration of Product classes
Organic:
Relatively small groups
working to develop well-understood applications.
Semidetached:
Project team consists of a mixture of experienced and inexperienced staff.
Embedded:
The software is strongly coupled to complex hardware, or real-time systems.
For each of the three product categories:
From size estimation (in KLOC), Boehm provides equations to predict:
project duration in months
effort in programmer-months
Boehm obtained these equations:
examined historical data collected from a large number of actual projects.
Software cost estimation is done through three stages:
Basic COCOMO,
Intermediate COCOMO,
Complete COCOMO.
Gives only an approximate estimation:
Effort = a1 (KLOC)a2
Tdev = b1 (Effort)b2
KLOC is the estimated kilo lines of source code,
a1,a2,b1,b2 are constants for different categories of software products,
Tdev is the estimated time to develop the software in months,
Effort estimation is obtained in terms of person months (PMs).
Development Effort Estimation
Organic :
Effort = 2.4 (KLOC)1.05 PM
Semi-detached:
Effort = 3.0(KLOC)1.12 PM
Embedded:
Effort = 3.6 (KLOC)1.20PM
Organic:
Tdev = 2.5 (Effort)0.38 Months
Semi-detached:
Tdev = 2.5 (Effort)0.35 Months
Embedded:
Tdev = 2.5 (Effort)0.32 Months


Development time does not increase linearly with product size:
For larger products more parallel activities can be identified:
can be carried out simultaneously by a number of engineers
Development time is roughly the same for all the three categories of products:
For example, a 60 KLOC program can be developed in approximately 18 months
regardless of whether it is of organic, semi-detached, or embedded type.
There is more scope for parallel activities for system and application programs,
than utility programs.
Example
The size of an organic software product has been estimated to be 32,000 lines of source code.
Effort = 2.4*(32)1.05 = 91 PM
Nominal development time = 2.5*(91)0.38 = 14 monthsExplain Intermediate COCOMO?
Ans:
Intermediate COCOMO
Basic COCOMO model assumes
effort and development time depend on product size alone.
However, several parameters affect effort and development time:
Reliability requirements
Availability of CASE tools and modern facilities to the developers
Size of data to be handled
For accurate estimation,
the effect of all relevant parameters must be considered:
Intermediate COCOMO model recognizes this fact:
refines the initial estimate obtained by the basic COCOMO by using a set of 15 cost drivers (multipliers).
If modern programming practices are used,
initial estimates are scaled downwards.
If there are stringent reliability requirements on the product :
initial estimate is scaled upwards.
Rate different parameters on a scale of one to three:
Depending on these ratings,
multiply cost driver values with the estimate obtained using the basic COCOMO.
Cost driver classes:
Product: Inherent complexity of the product, reliability requirements of the product, etc.
Computer: Execution time, storage requirements, etc.
Personnel: Experience of personnel, etc.
Development Environment: Sophistication of the tools used for software development.
Shortcoming of basic and intermediate COCOMO models
Both models:
consider a software product as a single homogeneous entity:
However, most large systems are made up of several smaller sub-systems.
Some sub-systems may be considered as organic type, some may be considered embedded, etc.
for some the reliability requirements may be high, and so on.
***************************************************************
Explain Complete COCOMO
Cost of each sub-system is estimated separately.
Costs of the sub-systems are added to obtain total cost.
Reduces the margin of error in the final estimate.
Complete COCOMO Example
A Management Information System (MIS) for an organization having offices at several places across the country:
Database part (semi-detached)
Graphical User Interface (GUI) part (organic)
Communication part (embedded)
Costs of the components are estimated separately:
summed up to give the overall cost of the system.
What is Halstead's Software Science?
Ans:
An analytical technique to estimate:
size,
development effort,
development time.
Halstead used a few primitive program parameters
number of operators and operands
Derived expressions for:
over all program length,
potential minimum volume
actual volume,
language level,
effort, and
development time.
********************************************************
What is critical path?
The term critical path refers to an input/output mechanism(process) that is of fundamental and critical importance to the life of prosperity of a particular project. The critical path specifically refers to the sequence or order of schedule activities that will make up the entire duration of a project. Typically, the critical path represents the longest path through the entirety of the project and typically this path consists of every single activity that must be concluded from the kickoff to the ultimate conclusion of the project. However, in some cases a critical path can terminate on a particular schedule milestone that does not come at the conclusion of the project. However, in these cases, typically, the schedule milestone in question will have a finish that comes at a time no later than that of the imposed date schedule restraint in question. That said, in more cases than not the critical path does indeed run the entire life of a project. For more information,
- critical path method(CPM): The term critical path method refers to a specific technique of schedule network analysis that is used to determine the...
- Critical Activity: The term critical activity refers to any particular schedule activity that happens to be part of a critical path that...
- Critical Chain Method: The phrase critical chain method refers to a specific project management technique in which a schedule network analysis is used...
- Network Path: The project management term network path refers to any consecutive or continuous series of work or project schedule activities that...
- Path Divergence : Similarly to its counterpart path convergence, path divergence plays a significant and important role in the life of a project...
One of the best advantages of creating a PERT chart during project planning is the insight it provides on theCritical Path. In our network diagram above, a critical path is the longest path traversed from the starting Node to the ending Node, in terms of the total of the calendar time taken to achieve each intermediate Node. All activities on this Critical Path must be completed on schedule for the project to finish on time. Seen in this light, each activity in the Critical Path is a critical activity, to be given the utmost attention. Resources from tasks which are not critical can be reallocated to assist Critical Path elements should issues arise, or inevitably unforeseen conditions occur. The process of managing the critical path is is referred to as Critical Path Management, or CPM.
On the other hand, an activity outside of the critical path "can" be delayed without the project getting delayed - for a certain amount of time. PERT experts call this the Slack Time for that particular activity.
Sometimes, the Critical Path is not immediately obvious when viewing the Chart cursorily. In such situations, we can determine the following four parameters associated with each activity:
- TES (Task Early Start) - the earliest start time of that activity. Working forward through the network (from start to finish), and keeping in mind the predecessor activities, the earliest time at which an activity can start.
- TEF (Task Early Finish) - the earliest finishing time of the activity. Usually, this is arrived at keeping in mind optimistic conditions.
- TLS (Task Late Start) - this is the latest time that the activity in question can begin. This value is arrived at by working backward through the network (from finish to the start), and keeping in mind the deadline for the project.
- TLF (Task Late Finish) - this is the latest time that the activity can end. Again, optimistic conditions are borne in mind while calculating this value.
Slack for each activity is then computed by subtracting TEF from TLF. The slack thus calculated may be noted on each Vector in the network diagram. The critical path shall then be a path that traverses the diagram across those Vectors where slack is Zero.
Staffing Level Estimation
Number of personnel required during any development project:
not constant.
Norden in 1958 analyzed many R&D projects, and observed:
Rayleigh curve represents the number of full-time personnel required at any time.
Rayleigh Curve

************************************************************************
Putnam’s Work:
In 1976, Putnam studied the problem of staffing of software projects:
observed that the level of effort required in software development efforts has a similar envelope.
found that the Rayleigh-Norden curve
relates the number of delivered lines of code to effort and development time.
Putnam analyzed a large number of army projects, and derived the expression:
L=CkK1/3td4/3
L=CkK1/3td4/3
K is the effort expended and L is the size in KLOC.
td is the time to develop the software.
Ck is the state of technology constant
reflects factors that affect programmer productivity.
Ck=2 for poor development environment
no methodology, poor documentation, and review, etc.
Ck=8 for good software development environment
software engineering principles used
Ck=11 for an excellent environment
Rayleigh Curve
Very small number of engineers are needed at the beginning of a project
carry out planning and specification.
As the project progresses:
more detailed work is required,
number of engineers slowly increases and reaches a peak.
Putnam observed that:
the time at which the Rayleigh curve reaches its maximum value
corresponds to system testing and product release.
After system testing,
the number of project staff falls till product installation and delivery.
From the Rayleigh curve observe that:
approximately 40% of the area under the Rayleigh curve is to the left of td
and 60% to the right.
Effect of Schedule Change on Cost
Using the Putnam's expression for L,
K=L3/Ck3td4
Or, K=C1/td4
K=L3/Ck3td4
Or, K=C1/td4
For the same product size, C1=L3/Ck3 is a constant.
Or, K1/K2 = td24/td14
Observe:
a relatively small compression in delivery schedule
can result in substantial penalty on human effort.
Also, observe:
benefits can be gained by using fewer people over a somewhat longer time span.
Example
If the estimated development time is 1 year, then in order to develop the product in 6 months,
the total effort and hence the cost increases 16 times.
In other words,
the relationship between effort and the chronological delivery time is highly nonlinear.
Putnam model indicates extreme penalty for schedule compression
and extreme reward for expanding the schedule.
Putnam estimation model works reasonably well for very large systems,
but seriously overestimates the effort for medium and small systems.
Boehm observed:
“There is a limit beyond which the schedule of a software project cannot be reduced by buying any more personnel or equipment.”
This limit occurs roughly at 75% of the nominal time estimate.
If a project manager accepts a customer demand to compress the development time by more than 25%
very unlikely to succeed.
every project has only a limited amount of parallel activities
sequential activities cannot be speeded up by hiring any number of additional engineers.
many engineers have to sit idle.
*********************************************************
Jensen Model:
Ans:
Jensen model is very similar to Putnam model.
attempts to soften the effect of schedule compression on effort
makes it applicable to smaller and medium sized projects.
Jensen proposed the equation:
L=CtetdK1/2
Where,
Cte is the effective technology constant,
td is the time to develop the software, and
K is the effort needed to develop the software.
************************************************************************ (2.8)Scheduling
Introduction
Company owners and project managers use the Work Breakdown Structure (WBS) to make complex projects more manageable. The WBS is designed to help break down a project into manageable chunks that can be effectively estimated and supervised.
Some widely used reasons for creating a WBS include:
Some widely used reasons for creating a WBS include:
- Assists with accurate project organization
- Helps with assigning responsibilities
- Shows the control points and project milestones
- Allows for more accurate estimation of cost, risk and time
- Helps explain the project scope to stakeholders
To start out, the project manager and subject matter experts determine the main deliverables for the project. Once this is completed, they start decomposing the deliverables they have identified, breaking them down to successively smaller chunks of work.
"How small?" you may ask. That varies with project type and management style , but some sort of predetermined “rule” should govern the size and scope of the smallest chunks of work. There could be a two weeks rule, where nothing is broken down any smaller than it would take two weeks to complete. You can also use the 8/80 rule, where no chunk would take less than 8 hours or longer than 80 hours to complete. Determining the chunk size “rules” can take a little practice, but in the end these rules make the WBS easier to use.
Regarding the format for WBS design, some people create tables or lists for their work breakdown structures, but most use graphics to display the project components as a hierarchical tree structure or diagram. In the article five phases of project management, author Deanna Reynolds describes one of many methods for developing a standard WBS.
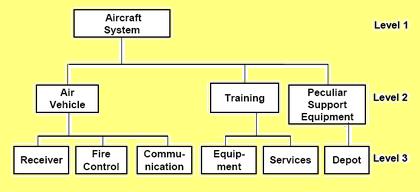
What is a Work Breakdown Structure Diagram?
A WBS diagram expresses the project scope in simple graphic terms. The diagram starts with a single box or other graphic at the top to represent the entire project. The project is then divided into main, or disparate, components, with related activities (or elements) listed under them. Generally, the upper components are the deliverables and the lower level elements are the activities that create the deliverables.
Information technology projects translate well into WBS diagrams, whether the project is hardware or software based. That is, the project could involve designing and building desktop computers or creating an animated computer game. Both of these examples have tasks that can be completed independently of other project tasks. When tasks in a project don’t need to be completed in a linear fashion, separating the project into individual hierarchical components that can be allotted to different people usually gets the job done quicker.
Information technology projects translate well into WBS diagrams, whether the project is hardware or software based. That is, the project could involve designing and building desktop computers or creating an animated computer game. Both of these examples have tasks that can be completed independently of other project tasks. When tasks in a project don’t need to be completed in a linear fashion, separating the project into individual hierarchical components that can be allotted to different people usually gets the job done quicker.
(2.9)Organization and Team Structures
Organization Structure
Functional Organization:
Engineers are organized into functional groups, e.g.
specification, design, coding, testing, maintenance, etc.
Engineers from functional groups get assigned to different projects
Advantages of Functional Organization
Specialization
Ease of staffing
Good documentation is produced
different phases are carried out by different teams of engineers.
Helps identify errors earlier.
Project Organization
Engineers get assigned to a project for the entire duration of the project
Same set of engineers carry out all the phases
Advantages:
Engineers save time on learning details of every project.
Leads to job rotation
Team Structure
Problems of different complexities and sizes require different team structures:
Chief-programmer team
Democratic team
Mixed organization
Democratic Teams
Suitable for:
small projects requiring less than five or six engineers
research-oriented projects
A manager provides administrative leadership:
at different times different members of the group provide technical leadership.
Democratic organization provides
higher morale and job satisfaction to the engineers
therefore leads to less employee turnover.
Suitable for less understood problems,
a group of engineers can invent better solutions than a single individual.
Disadvantage of Democratic Teams:
team members may waste a lot time arguing about trivial points:
absence of any authority in the team.
********************************************************************************
Chief Programmer Team
A senior engineer provides technical leadership:
partitions the task among the team members.
verifies and integrates the products developed by the members.
Works well when
the task is well understood
also within the intellectual grasp of a single individual,
importance of early completion outweighs other factors
team morale, personal development, etc.
Chief programmer team is subject to single point failure:
too much responsibility and authority is assigned to the chief programmer.
****************************************************************************
Mixed Control Team Organization
Draws upon ideas from both:
democratic organization and
chief-programmer team organization.
Communication is limited
to a small group that is most likely to benefit from it.
Suitable for large organizations.

(2.10) Risk Management
Risk Analysis:
Risk analysis and management are a series of steps that help a software team to understand and manage uncertainty. Many problems can plague of software project. A risk is a potential problem; it might happen, it might not. But regardless of the outcome, it's a really good idea to identify it, assess its probability of occurrence, estimate its impact, and establish a contingency plan should the problem actually occur.
Software project management cannot be performed without a good practice to handle all these unknown parameters. A project manager has to be able to live with uncertainties(doubts), and have a good way to structure his approach to handle them. The first is a personal aspect, which you have to do all by yourself. The latter is where "project risk management" comes in…
"Project risk management focuses the project manager's attention on those portions of the project most likely to cause trouble and to compromise participants' win conditions."
So, in other words, it's a set of actions which helps the project manager structure his approach on dealing with the unknown or the "things not sure".
"… we define risk as the possibility of loss. We obtain an instance of risk by specifying values for the risk attributes of probability (the possibility) and consequence (the loss). Probability is the likelihood that the consequence will occur. Consequence is the effect of an unsatisfactory outcome."
So, the idea is to specify explicitly the items that you are not sure about and define what will happen if what is expected (or assumed) is not true.
If you are not sure about the estimate ending of a certain task, you can define the risk for this situation as follows: delay of the actual end of the activity * very likely to happen. What the consequences and advantages are of this approach, is the subject of this section.
Risk is not a bad thing
The problem with risk management is the negative image of the word "risk". Of course, unless there is a potential for loss, there is no risk. The loss can be either a bad outcome or a lost opportunity. The tendency of most stakeholders is to jump very stressfully at the statement "this is a risk". Therefore most of the time it's not very easy to discuss about risks, because that's always a conversation about problems. It's very important the risk is not perceived as a bad thing, but as a positive attitude to make sure everyone will become a winner in the end.
Remember, risk management helps you being aware of the goals you have to achieve, and what can happen if you don't satisfy the goals. It supports you in making the right choices!
So, risk is not a bad thing! Say it loud! Spread the word!
(2.11) Risk Identification
Risk Identification:
After establishing the context, the next step in the process of managing risk is to identify potential risks. Risks are about events that, when triggered(occurred), cause problems. Hence, risk identification can start with the source of problems, or with the problem itself.
- Source analysis Risk sources may be internal or external to the system that is the target of risk management.
Examples of risk sources are: stakeholders of a project, employees of a company or the weather over an airport.
- Problem analysis Risks are related to identified threats. For example: the threat of losing money, the threat of abuse of privacy information or the threat of accidents and casualties. The threats may exist with various entities, most important with shareholders, customers and legislative bodies such as the government.
When either source or problem is known, the events that a source may trigger or the events that can lead to a problem can be investigated. For example: stakeholders withdrawing during a project may endanger funding of the project; privacy information may be stolen by employees even within a closed network; lightning striking an aircraft during takeoff may make all people onboard immediate casualties.
The chosen method of identifying risks may depend on culture, industry practice and compliance. The identification methods are formed by templates or the development of templates for identifying source, problem or event. Common risk identification methods are:
- Objectives-based risk identification Organizations and project teams have objectives. Any event that may endanger achieving an objective partly or completely is identified as risk.
- Scenario-based risk identification In scenario analysis different scenarios are created. The scenarios may be the alternative ways to achieve an objective, or an analysis of the interaction of forces in, for example, a market or battle. Any event that triggers an undesired scenario alternative is identified as risk.
- Taxonomy-based risk identification The taxonomy in taxonomy-based risk identification is a breakdown of possible risk sources. Based on the taxonomy and knowledge of best practices, a questionnaire is compiled. The answers to the questions reveal risks.
- Common-risk checking In several industries, lists with known risks are available. Each risk in the list can be checked for application to a particular situation.
- Risk charting This method combines the above approaches by listing resources at risk, Threats to those resources Modifying Factors which may increase or decrease the risk and Consequences it is wished to avoid. Creating a matrix under these headings enables a variety of approaches. One can begin with resources and consider the threats they are exposed to and the consequences of each. Alternatively one can start with the threats and examine which resources they would affect, or one can begin with the consequences and determine which combination of threats and resources would be involved to bring them about.
After all the identified risks of a project are assessed, plans must be made to contain the most damaging and the most likely risks. Different risks require different containment procedures. In fact, most risks require ingenuity on the part of the project manager deal with them.
There are three main strategies used for risk containment:
Avoid the risk:
This may take several forms such as discussions with the client(customer) to reduce the scope of the work, and giving incentives to engineers to avoid the risk of manpower turnover, etc.
Transfer the risk:
this strategy involves getting the risky component developed by a third party, or buying insurance cover, etc.
Risk Reduction:
this involves planning ways to contain the damage due to a risk. For example, if there is risk that some key personnel might leave, new recruitment may be planned.
(2.10) Software Configuration Management
(2.10) Necessity of Software configuration Management
(2.10)Configuration Management Activities
(2.10) Source code Control System (SCCS) and RCS
(2.8)Scheduling
Delphi Cost Estimation
The Delphi technique was developed at the
There are five steps in the Standard Delphi technique for cost Estimation are:
- Coordinator gives the SRS document to each expert for recording his cost estimate.
- Estimators study the definition and complete their estimates anonymously(i.e in secret). They may ask questions of the coordinator, but they do not discuss their estimates with one another.
- The coordinator prepares and distributes a summary of the estimators’ responses, and includes any unusual rationales(any fundamental reason) noted by the estimators.
- Estimators complete another estimate again anonymously using the results from the previous estimate. Estimators whose estimates differ sharply from the group may be asked, to provide justification for their estimates.
- Experts fill out forms, again anonymously, and the process is repeated(iterated) for as many rounds as required. No group discussion is allowed during the entire process.
The Wideband Delphi Technique:
1. Objective
To define an estimation method using Wide Band Delphi Technique.
2. Scope
This guideline is applicable for all estimations using the above method.
3. Use
To predict the size of a software product at the end of analysis process.4. Inputs
Software Requirement Specifications (SRS).
5. Steps
A group of two to five experts is selected to participate in the exercise.
Each expert is presented with the SRS and the Delphi Size Estimate Iteration
Form.
-
All the experts meet to discuss the application issues related to size.
-
Each expert produces an estimate using any agreed estimation method and records
the estimation form anonymously.
-
The coordinator competes the second part of the Delphi Size Estimate Iteration
Form.
-
The experts meet to discuss the highest and lowest estimates. The identities of the
estimators giving these estimates are not disclosed.
-
If there is no consensus on the lowest possible and the highest possible estimates,
the process is continued from step
6. Outputs
- Maximum Estimate
- Minimum Estimate
- Median Estimate
2.8.3:
Gantt Charts: (march/april 2008)
Gantt Charts:
The ability to communicate is a definitive prerequisite(precondition or requirement) for successful management of a project. Graphical displays such as gantt-charts usually make the information easy to identify; and thus are the prime means for tracking cost, schedule and performance.
Gantt-chart, being the most common type of display, is named after Henry Gantt, who first utilized(used) this procedure in the early 1900s. The gantt-chart (or the bar chart) is a mean of displaying simple activities or events plotted against time. An activity represents the amount of work required to proceed from one point to another. Events are described as either the starting or ending point for either one or several activities.
Gantt charts are most commonly used for exhibiting program progress or defining specific work required to accomplish an objective. They often include such items as listing of activities, activity duration, schedule dates, and progress-to-date.
Gantt-charts are advantageous in that they are simple to understand and easy to change. They are the least complex means of portraying progress (or lack of it) and can easily be expanded to identify specific elements that may be either behind or ahead of schedule.
The benefits for project management, that gantt-charts can result in, include:
- Cutting project cost and reducing the time scale
- Coordinating and expediting planning
- Eliminating idle time
- Obtaining better scheduling and control for subcontractor activities
- Developing better troubleshooting procedures
- Cutting time for routine decisions, but allowing more time for decision making

Note:
/* for more clarity to understand about the gantt char, just read the following, no need to write in the exm*/
(for example, if the project is outfitting your computer with new software, the major tasks involved might be: conduct research, choose software, install software). Horizontal bars of varying lengths represent the sequences, timing, and time span for each task. Using the same example, you would put "conduct research" at the top of the verticle axis and draw a bar on the graph that represents the amount of time you expect to spend on the research, and then enter the other tasks below the first one and representative bars at the points in time when you expect to undertake them. The bar spans may overlap, as, for example, you may conduct research and choose software during the same time span. As the project progresses, secondary bars, arrowheads, or darkened bars may be added to indicate completed tasks, or the portions of tasks that have been completed. A vertical line is used to represent the report date.


Project
Release Process to client Organization

/* for more clarity to understand about the gantt char, just read the following, no need to write in the exm*/
(for example, if the project is outfitting your computer with new software, the major tasks involved might be: conduct research, choose software, install software). Horizontal bars of varying lengths represent the sequences, timing, and time span for each task. Using the same example, you would put "conduct research" at the top of the verticle axis and draw a bar on the graph that represents the amount of time you expect to spend on the research, and then enter the other tasks below the first one and representative bars at the points in time when you expect to undertake them. The bar spans may overlap, as, for example, you may conduct research and choose software during the same time span. As the project progresses, secondary bars, arrowheads, or darkened bars may be added to indicate completed tasks, or the portions of tasks that have been completed. A vertical line is used to represent the report date.
Gantt charts give a clear illustration of project status, but one problem with them is that they don't indicate task dependencies - you cannot tell how one task falling behind schedule affects other tasks. The PERT chart, another popular project management charting method, is designed to do this. Automated Gantt charts store more information about tasks, such as the individuals assigned to specific tasks, and notes about the procedures. They also offer the benefit of being easy to change, which is helpful. Charts may be adjusted frequently to reflect the actual status of project tasks as, almost inevitably, they diverge from the original plan.
PERT Charts
A PERT chart is a project management tool used to schedule, organize, and coordinate tasks within a project. PERT stands for Program Evaluation Review Technique, a methodology developed by the U.S. Navy in the 1950s to manage the Polaris submarine missile program. A similar methodology, the Critical Path Method (CPM) was developed for project management in the private sector at about the same time.


A PERT chart presents a graphic illustration of a project as a network diagram consisting of numbered nodes (either circles or rectangles) representing events, or milestones in the project linked by labelled vectors (directional lines) representing tasks in the project. The direction of the arrows on the lines indicates the sequence of tasks. In the diagram, for example, the tasks between nodes 1, 2, 4, 8, and 10 must be completed in sequence. These are called dependent or serial tasks. The tasks between nodes 1 and 2, and nodes 1 and 3 are not dependent on the completion of one to start the other and can be undertaken simultaneously.
These tasks are called parallel or concurrent tasks. Tasks that must be completed in sequence but that don't require resources or completion time are considered to have event dependency. These are represented by dotted lines with arrows and are called dummy activities. For example, the dashed arrow linking nodes 6 and 9 indicates that the system files must be converted before the user test can take place, but that the resources and time required to prepare for the user test (writing the user manual and user training) are on another path. Numbers on the opposite sides of the vectors indicate the time allotted for the task.
The PERT chart is sometimes preferred over the Gantt chart, another popular project management charting method, because it clearly illustrates task dependencies. On the other hand, the PERT chart can be much more difficult to interpret, especially on complex projects. Frequently, project managers use both techniques.
2.13 SOFTWARE CONFIGURATION MANAGEMENT
2.13 SOFTWARE CONFIGURATION MANAGEMENT (SCM)
The results (deliverables) of a large software development effort contains of a large no.of objects (i.e: source code, design document, SRS document, test document, user's manual) These objects are usually referred to and modified by a number of software engineers throughout the life cycle of the software. The state of all these objects at any point of time is called the configuration of the software product. The state of each deliverable object changes as development progresses and also as bugs(errors) are detected(found) and fixed(corrected). Software configuration management deals with tracking and controlling the configuration of a software product(project) during its life cycle.
The need of SCM in General is:
- Configuration Identification: wat code are we working with?
- Configuration Control: controlling the release of a product and its changes.
- Status Accounting: Recording and reporting the status of components.
- Review: Ensuring completeness and consistency among componenets.
- Build Mnanagement: Managing the process and tools used for builds.
- Process Management: Ensuring adherence(sticking, faithfullness) to the organisation's development process
- Environment Management: Managing the software and hardware that host system.
- Team Work: Facilitate team interactions related to the process
- Defect (Error) Tracking: making sure every defect has traceability back to the source
Ans: it is also known as version control and source control, is the management of changes to documents,programs, large web sites and other information stored as computer files. which contains
the text documents the primary goal of RCS is managing the revisions which is collection of text documents
the text documents the primary goal of RCS is managing the revisions which is collection of text documents
RCS also used to merge the customer modifications for software development
Project Management Methodology.. Its rocking..
ReplyDeleteThis is fascinating! I had not heard of any of these programs before. However, some of the additional features in these online project management software may help me even more.
ReplyDeleteVendor relationship management
ReplyDeleteThank you for sharing this information and Very good looking blog on
ReplyDeleteSoftware Estimation Techniques Training in Chennai
ataşehir daikin klima servisi
ReplyDeleteçekmeköy lg klima servisi
çekmeköy alarko carrier klima servisi
ataşehir alarko carrier klima servisi
maltepe toshiba klima servisi
kadıköy toshiba klima servisi
maltepe beko klima servisi
kadıköy beko klima servisi
kartal lg klima servisi